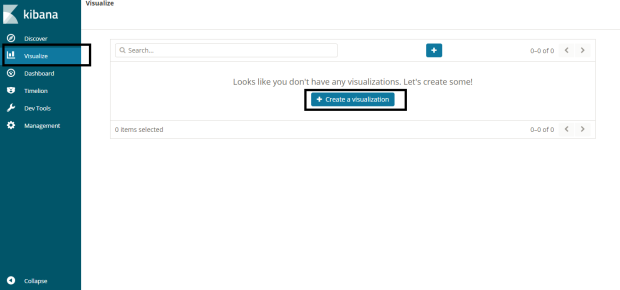
Go to visualize
Select create Dash Board
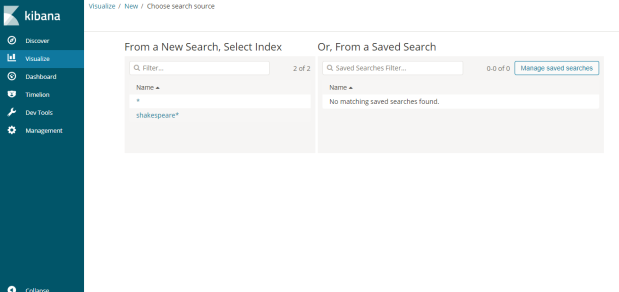
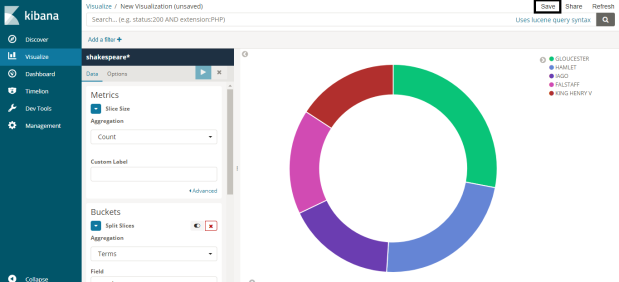
EX: select Pie chart as example
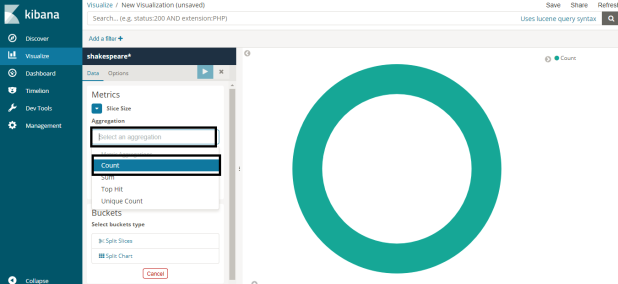
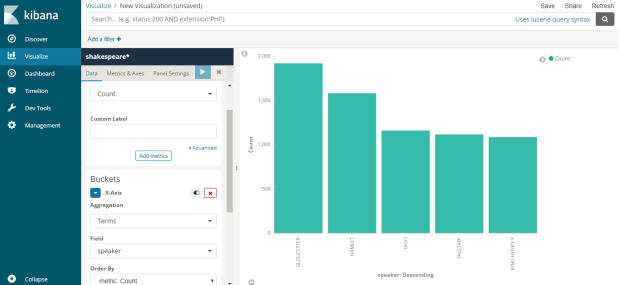
select count as an example
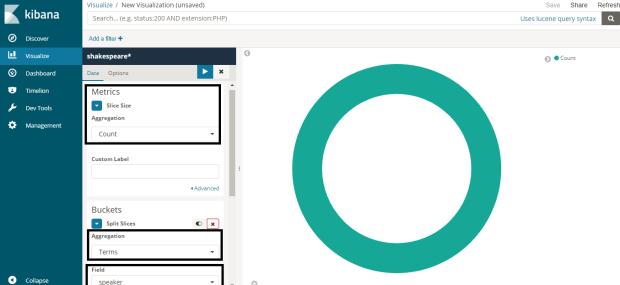
Select Aggregations with in that select Terms
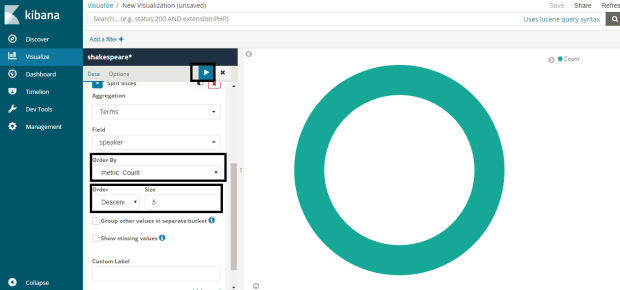
If you any specific requirements please select the order as well. And apply the play option
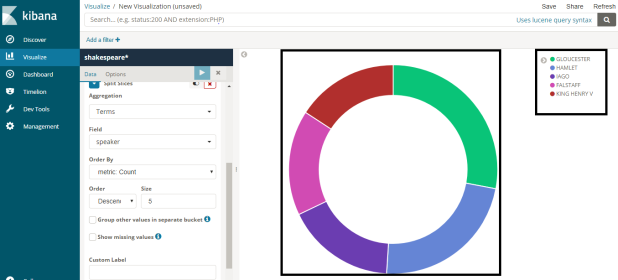
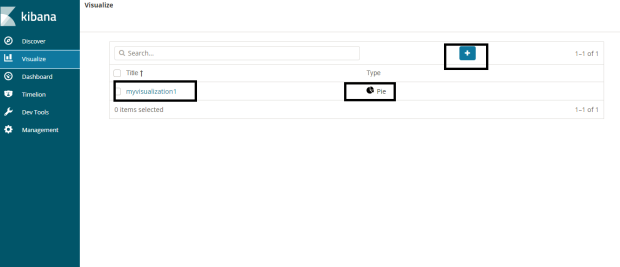
If you want that visualization to be saved for future reference plz select save option present on right corner.
same with vertical Bar as well