[root@prom1 ~]# useradd prometheus
[root@prom1 ~]# su – prometheus
[prometheus@prom1 ~]$ wget https://github.com/prometheus/node_exporter/releases/download/v0.14.0/node_exporter-0.14.0.linux-amd64.tar.gz
[prometheus@prom1 ~]$ ls -l
total 3928
-rw-rw-r–. 1 prometheus prometheus 4019675 Nov 26 02:42 node_exporter-0.14.0.linux-amd64.tar.gz
[prometheus@prom1 ~]$ mkdir -p Prometheus/node_exporter
[prometheus@prom1 ~]$ cd $_
[prometheus@prom1 node_exporter]$
[prometheus@prom1 node_exporter]$ tar xzf ../../node_exporter-0.14.0.linux-amd64.tar.gz
[prometheus@prom1 node_exporter]$ logout
[root@prom1 ~]# vim /etc/systemd/system/node_exporter.service
# echo “[Unit]
Description=Node Exporter
[Service]
User=prometheus
ExecStart=/home/prometheus/Prometheus/node_exporter/node_exporter-0.14.0.linux-amd64/node_exporter
[Install]
WantedBy=default.target > /etc/systemd/system/node_exporter.service
[root@prom1 ~]# systemctl start node_exporter.service
[root@prom1 ~]# netstat -tlpn
Active Internet connections (only servers)
Proto Recv-Q Send-Q Local Address Foreign Address State PID/Program name
tcp 0 0 0.0.0.0:22 0.0.0.0:* LISTEN 897/sshd
tcp 0 0 127.0.0.1:25 0.0.0.0:* LISTEN 1144/master
tcp6 0 0 :::9100 :::* LISTEN 11796/node_exporter
tcp6 0 0 :::22 :::* LISTEN 897/sshd
tcp6 0 0 ::1:25 :::* LISTEN 1144/master
[root@prom1 ~]# systemctl status node_exporter.service
● node_exporter.service
Loaded: loaded (/etc/systemd/system/node_exporter.service; disabled; vendor preset: disabled)
Active: active (running) since Sun 2017-11-26 02:53:36 UTC; 2min 38s ago
Main PID: 11796 (node_exporter)
CGroup: /system.slice/node_exporter.service
└─11796 /home/prometheus/Prometheus/node_exporter/node_exporter-0.14.0.linux-amd64/node_exporter
[root@prom1 ~]# su – prometheus
Last login: Sun Nov 26 02:41:45 UTC 2017 on pts/0
[prometheus@prom1 ~]$ wget https://github.com/prometheus/prometheus/releases/download/v1.7.1/prometheus-1.7.1.linux-amd64.tar.gz
[prometheus@prom1 ~]$ cd Prometheus
[prometheus@prom1 Prometheus]$ tar xzf ../prometheus-1.7.1.linux-amd64.tar.gz
[prometheus@prom1 Prometheus]$ cd prometheus-1.7.1.linux-amd64
[prometheus@prom1 prometheus-1.7.1.linux-amd64]$ ls -l
total 70224
drwxrwxr-x. 2 prometheus prometheus 38 Jun 12 11:42 console_libraries
drwxrwxr-x. 2 prometheus prometheus 4096 Jun 12 11:42 consoles
-rw-rw-r–. 1 prometheus prometheus 11357 Jun 12 11:42 LICENSE
-rw-rw-r–. 1 prometheus prometheus 2793 Jun 12 11:42 NOTICE
-rwxr-xr-x. 1 prometheus prometheus 61829345 Jun 12 11:45 prometheus
-rw-rw-r–. 1 prometheus prometheus 995 Jun 12 11:42 prometheus.yml
-rwxr-xr-x. 1 prometheus prometheus 10051241 Jun 12 11:45 promtool
[prometheus@prom1 prometheus-1.7.1.linux-amd64]$ vim prometheus.yml
scrape_configs:
– job_name: ‘prometheus’
scrape_interval: 1s
static_configs:
– targets: [‘localhost:9090’]
– job_name: ‘node_exporter’
scrape_interval: 1s
static_configs:
– targets: [‘localhost:9100’]
[root@prom1 ~]# vim /etc/systemd/system/prometheus.service
# echo “[Unit]
Description=Prometheus Server
Documentation=https://prometheus.io/docs/introduction/overview/
After=network-online.target
[Service]
User=prometheus
Restart=on-failure
ExecStart=/home/prometheus/Prometheus/prometheus-1.7.1.linux-amd64/prometheus -config.file=/home/prometheus/Prometheus/prometheus-1.7.1.linux-amd64/prometheus.yml -storage.local.path=/home/prometheus/Prometheus/prometheus-1.7.1.linux-amd64/data
[Install]
WantedBy=multi-user.target > /etc/systemd/system/prometheus.service
[root@prom1 ~]# systemctl daemon-reload
[root@prom1 ~]# systemctl enable prometheus.service
[root@prom1 ~]# systemctl start prometheus.service
[root@prom1 ~]# netstat -tlpn
Active Internet connections (only servers)
Proto Recv-Q Send-Q Local Address Foreign Address State PID/Program name
tcp 0 0 0.0.0.0:22 0.0.0.0:* LISTEN 897/sshd
tcp 0 0 127.0.0.1:25 0.0.0.0:* LISTEN 1144/master
tcp6 0 0 :::9100 :::* LISTEN 11796/node_exporter
tcp6 0 0 :::22 :::* LISTEN 897/sshd
tcp6 0 0 ::1:25 :::* LISTEN 1144/master
tcp6 0 0 :::9090 :::* LISTEN 11953/prometheus
[root@prom1 ~]# systemctl status prometheus.service
● prometheus.service
Loaded: loaded (/etc/systemd/system/prometheus.service; disabled; vendor preset: disabled)
Active: active (running) since Sun 2017-11-26 03:04:07 UTC; 54s ago
Main PID: 11953 (prometheus)
CGroup: /system.slice/prometheus.service
└─11953 /home/prometheus/Prometheus/prometheus-1.7.1.linux-amd64/prometheus -config.file=/home/prometheus/Prometheus/prometheus-1.7.1.linux-amd64/prometh…
[root@prom1 ~]# yum install https://s3-us-west-2.amazonaws.com/grafana-releases/release/grafana-4.4.1-1.x86_64.rpm
[root@prom1 ~]# systemctl daemon-reload
[root@prom1 ~]# systemctl enable grafana-server.service
Created symlink from /etc/systemd/system/multi-user.target.wants/grafana-server.service to /usr/lib/systemd/system/grafana-server.service.
[root@prom1 ~]# systemctl start grafana-server.service
[root@prom1 ~]# netstat -tlpn
Active Internet connections (only servers)
Proto Recv-Q Send-Q Local Address Foreign Address State PID/Program name
tcp 0 0 0.0.0.0:22 0.0.0.0:* LISTEN 897/sshd
tcp 0 0 127.0.0.1:25 0.0.0.0:* LISTEN 1144/master
tcp6 0 0 :::9100 :::* LISTEN 11796/node_exporter
tcp6 0 0 :::22 :::* LISTEN 897/sshd
tcp6 0 0 :::3000 :::* LISTEN 12226/grafana-serve
tcp6 0 0 ::1:25 :::* LISTEN 1144/master
tcp6 0 0 :::9090 :::* LISTEN 11953/prometheus
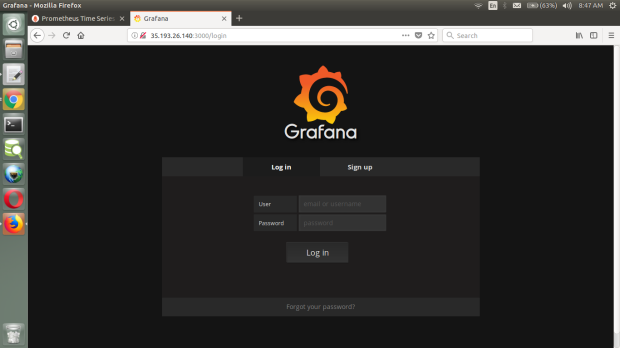
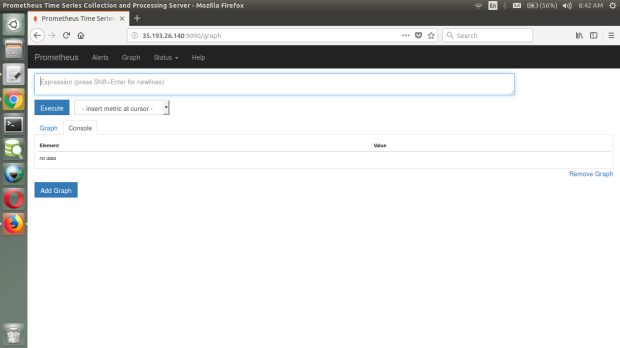
Next, we need to hook up grafana with prometheus. First, go to hostname:3000.
– Login with admin/admin
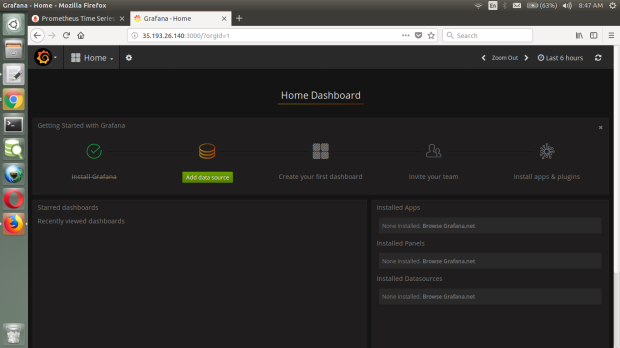
– Click ‘add datasource’
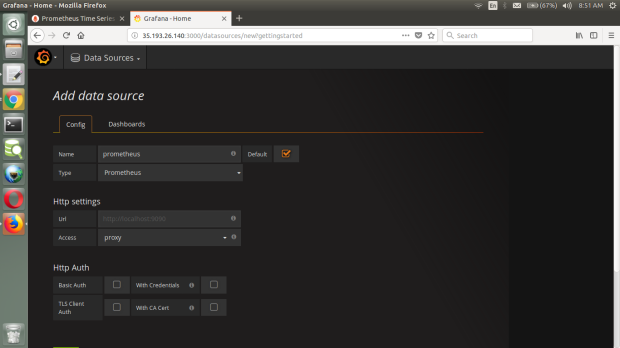
– Name: prometheus, Type: Prometheus
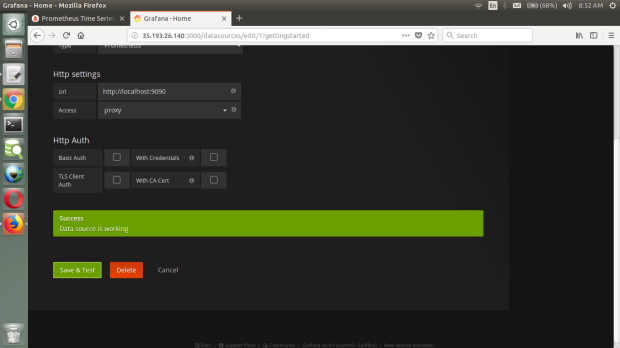
– Http settings: http://localhost:9090, select Access: ‘proxy’.
– Click ‘save and test’. This should result in ‘success’ and ‘datasource updated.’
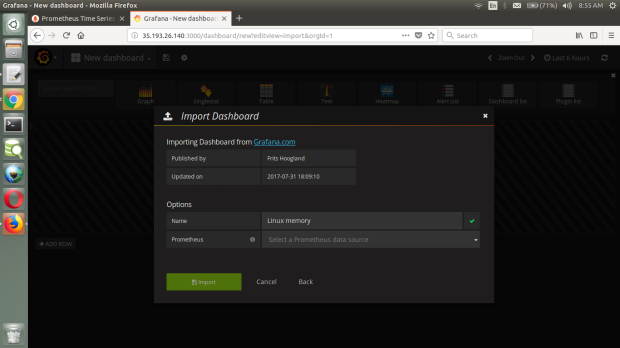
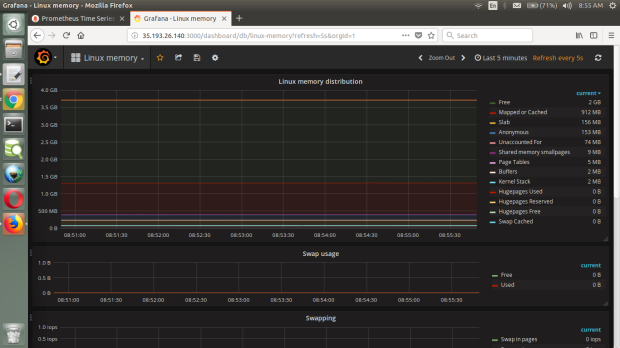
Now click on the grafana symbol in the left upper corner, dashboards, import. Enter ‘2747’ at ‘grafana.com dashboard’. This will say ‘Linux memory’, select the prometheus datasource which you just defined, and click import.